Gaiak
Decision making on a street map of Tudela
AZCONA MAGAÑA, Iván GÓMEZ CALVO, Javier SIMÓN SOLDEVILLA, Carlos
1. Introduction
This method is used by a lot of individuals and organizations in order to create smarter traffic models upon a region or city. A smart traffic should limit pollution, fuel consumption, displacement time and reduce accidents among other important factors. Smart transportation is beneficial for both pedestrians and drivers and is certainly fundamental for every township in the near future. At the moment, a lot of big cities are using the newest technology in order to update and regulate their traffic, but not every populace is aware of how important this is.
There is a lot of software available to perform this type of study but in this particular case we have used the program PTV Vissim. There, with the creation of a model that assimilates with reality, different tests have been done to break down the until finally finding the optimal traffic structure. The analysis and improvement of a selected reduced area from Tudela (Navarra) s the importance and credibility of this method, which can be used in further projects of the city itself.
2. Object of study
The object which is going to be studied is a traffic section from Tudela, Navarra. The purpose of this project is to detect the different traffic problems of the selected section and, through the help of artificial intelligence, make decisions in order to improve the traffic of the zone in general. The section has been chosen for various reasons such as being a zone that deals with a lot of traffic and containing some interesting places such as a supermarket, a pharmacy and a well-structured neighbourhood.
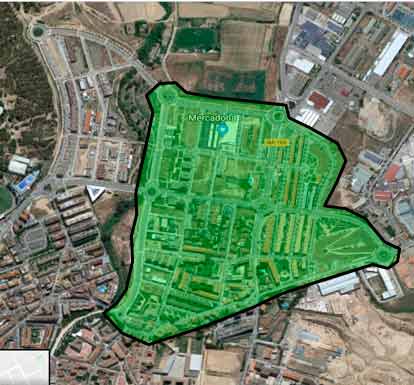
Fig. 1. Section of Tudela which is going to be under analysis (own elaboration).
3. State of the art
As of right now, there is a wide variety of articles providing information about how to achieve a smart , through simulating with various artificial intelligent s. Nevertheless, these investigations do not usually the actual results of the simulations, which is the most important part in these types of research. Without an actual proof, you can not state a strong conclusion and, therefore, you can not change a street map or make decisions on it.
The main objective of these types of investigations should be concerning the problems within the simulated area and providing quality results which would justify the potential solutions of these problems, which is something that the current researches do not have. This investigation completes all the things missing from all those projects that propose the study but do not actually perform one. Additionally to the creation of a simulation model, this investigation offers a number of results related with the traffic flow and contamination levels which is what these investigations lack. These results are the ones, as we said before, in which people will look into when finding the credibility of our proposed traffic distribution changes.
A lot of the current researches talk about how the implementation of an artificial intelligent method can reduce the contamination produced within the area however, once again, they do not any result or conclusion regarding this. Without any data, this statement, even though it is true, can not concern people at all. In this investigation, we have been able to provide impactful contamination-related results which we believe that that with an efficient and organised simulation model, contamination levels can be successfully studied and, therefore, improved.
4. Objectives
The main objective of simulating traffic is being able to analyse and contrast its errors in order to improve the street map so then those results can be applied to the real situation. Every traffic map has got some errors to improve, therefore, Tudela’s traffic is going to different disadvantages which have to be minimised or erased. The different solutions for these problems are the general objectives of the project and can be summarised in the following ones:
- Reducing density of cars in some streets.
- Reducing transit time of vehicles to complete their routes.
- Reducing the general pollution emitted by the vehicles
- Contribute to sustainable mobility
All objectives are focused towards obtaining better traffic conditions and, overall, an optimistic and technologically-smart based-life in Tudela.
5. Hypothesis
The simulation and study of the traffic from a selected region in Tudela s that Tudela’s traffic contains different problems such as a high traffic density, long travel periods and high pollution. Those problems could be solved with the introduction of artificial intelligence analysing methods which helps in the decision making of the street map.
If the hypothesis ends up being true, then the following errors reported in this project could be directly applied in order to improve the traffic conditions.
6. Results, discussion and assessment
6.1 Related with traffic flow problems
In our simulation model created in PTV Vissim, we were able to visually identify the different traffic problems in our selected area. However, we found out that the traffic flow in the section was quite fluid and that there was not a major error that needed to be fixed as soon as possible, but rather few and small ones:
- Even though the supermarket Mercadona has three different entries to their parking, the one located on the right side is used way more frequently than the other two due to the streets organization, consequently creating a big traffic density on the road that connects with this entry
We further investigated the Supermarket’s entry problems and, even though it is true that the left side of Mercadona is devalued in terms of traffic at the moment, it is because that part has been built looking towards the future. That roundabout which at the moment does not lead into any important section, is planned to be the connection the section that we have studied and a large residential zone which has not been built yet. Nowadays, Mercadona’s entries are clearly not balanced but, in the near future when that residential zone is completed, they will be
- We found an intersection which we did not find appropriate
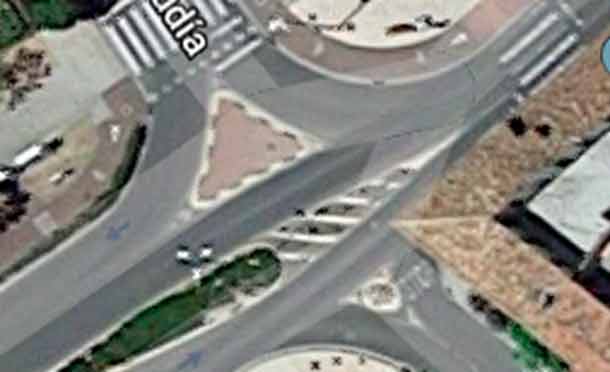
Fig. 2. Picture of the inappropriate intersection.
When we deeply analysed the intersection which we found out that it had some problems, we realised that cars are not able to go into all the directions, but are limited due to the cones that separates both roads. This increases the average travel time of the cars within the section and it certainly disturbs those who have to make these long moves which could be a lot faster if the intersection was differently organised
The solution we have found is creating a small roundabout that allows the driver to choose wherever he wants to go. The space in the intersection is not very big but it is big enough to make a roundabout consisting of one line, which means that all the entrances and exits to the roundabout would consist of only a single line.
6.2 Related with travel time
In order to start with the simulations, we first needed to know two things about the zone: the traffic density and the different routes that the cars take. By counting cars passing by in different points of the zone, we were able to calculate the average amount of cars that drive by in the section per hour: 3920 cars. After analyzing the primary destinations and roads within the section, we defined 82 different routes for the cars in our simulation. Combining those routes probabilities and the traffic density we have been able to apply a realistic criteria to our results.
We created a template with all the routes and its respectives travel times. We divided our section into several colors to then apply those colors into the cells with the time transition information corresponding with that color zone. In that way, readers are able to understand the data in the chart and identify the route that the car has taken.
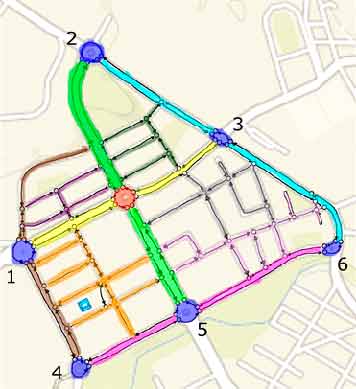
Fig. 3. The simulated section divided into different color zones (own elaboration).
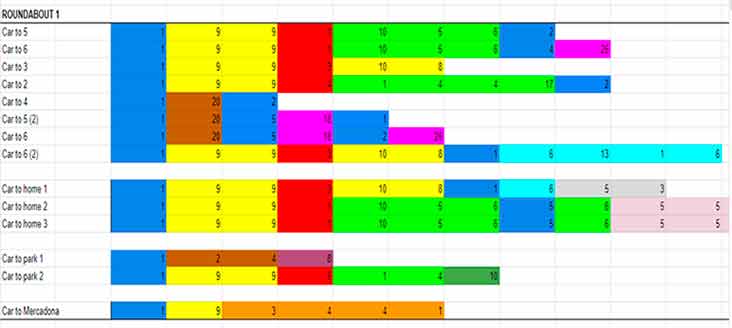
Fig. 4. Example of a template that s all the routes that start from roundabout 1 (own elaboration).
We made a Google Spreadsheets document in which each page s simulations of 3 minutes and the respective travel times of the cars. The cells of the pages are filled with the templates of the routes we mentioned before. The document consists of 50 of these pages and then, by putting all the pages’ results together we were able to find a more accurate average time travel.
The results from all the pages of the Google Spreadsheets document were put into the next graphic which s the variation of the average time travel throughout all the different simulations pages.
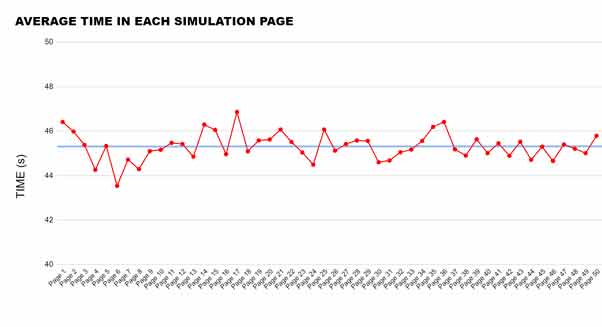
Fig. 5. Average time in each simulation page from the Google Spreadsheet document (own elaboration).
According to our simulations and to the algorithm we created, the average travel time per car within our studied section is of 45.31s approximately.
According to the page equaindex.com, the average CO2 emission generated by european’s cars: 180.66 g/km. Combining this number with the average travel time in the section (45.31s), we can obtain the average CO2 emitted by a car throughout the analysed section. If a car is on the section for about 45.31 seconds at a speed of 50 km/h it means that the car moves about 0.63 km inside the section. Therefore, the general pollution generated by a car throughout the section is of 113.82g of CO2
As we already know the traffic density of the section, we can calculate the approximate CO2 emitted in a whole year. 2605.66 tons of CO2 is emitted per year. The next chart also s the pollution created by each type of fuel .
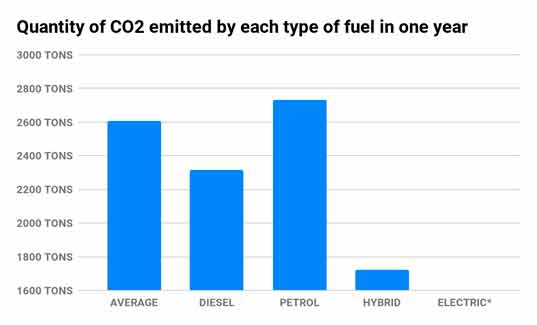
*The quantity of CO2 pollution depends on the method in which the electrical energy is obtained,
but the car itself does not produce emissions.
Fig. 6. Quantity of CO2 emitted by each type of fuel inside the analysed section in a year (own elaboration).
7. Conclusions
Our hypothesis, where we stated that with our study we would traffic flow problems and a high pollution in the section, is correct. The street distribution of this section was recently designed which means that the area does not have any major traffic-related problem and, overall, the traffic within it is very fluent and efficient. Still, we were able to find some traffic flow problems which s that problems can be found in any traffic area if a deep study is done towards it. It is important to solve those problems, even though they might not look important enough, as those little changes are the ones that have the ability to highly reduce contamination when talking about long periods of time.
With the remodeling of the mentioned intersection and the creation of a roundabout on it, we can potentially satisfy some of the driver's needs as we expand his possibilities when reaching the intersection. As we said, with the current intersection model, cars have to drive further into the next roundabout if they want to make some moves and, with our model, this problem is solved, consequently decreasing the travel periods and, therefore, decreasing the contamination.
About the contamination levels, even though the results were of just a small area of Tudela, we think that were able to impactful results related with the emissions generated by cars driving through the zone. If you compare those huge contamination numbers with the relatively small extension of the zone you will find out how much traffic pollutes. And how much does humanity pollute overall. Those numbers have been calculated with the traffic density of the section of Tudela, which means that it is a much smaller value than the real one. We would have to take into consideration the huge traffic density inside cities which would lead us into a far more impactful result.
This study has n that the solution to these contamination problems related with traffic depends on the traffic organization and the type of transport that is used. The traffic organization may not have to do with many of us, but we can surely improve the contamination numbers by contributing to sustainable mobility. Whenever you are going to buy a new car, take into account how it affects the environment. It is not just concluded by our investigation but of many others than hybrid and electrical cars are the way to go if we want to start making the difference. Also remember that choosing to ride a bicycle or walk for short distances instead of driving saves a considerable amount of contamination. At the moment, we are in a delicate situation and any positive contribution towards the environment means a step forward towards a brighter future. So, why do we not start just now?


